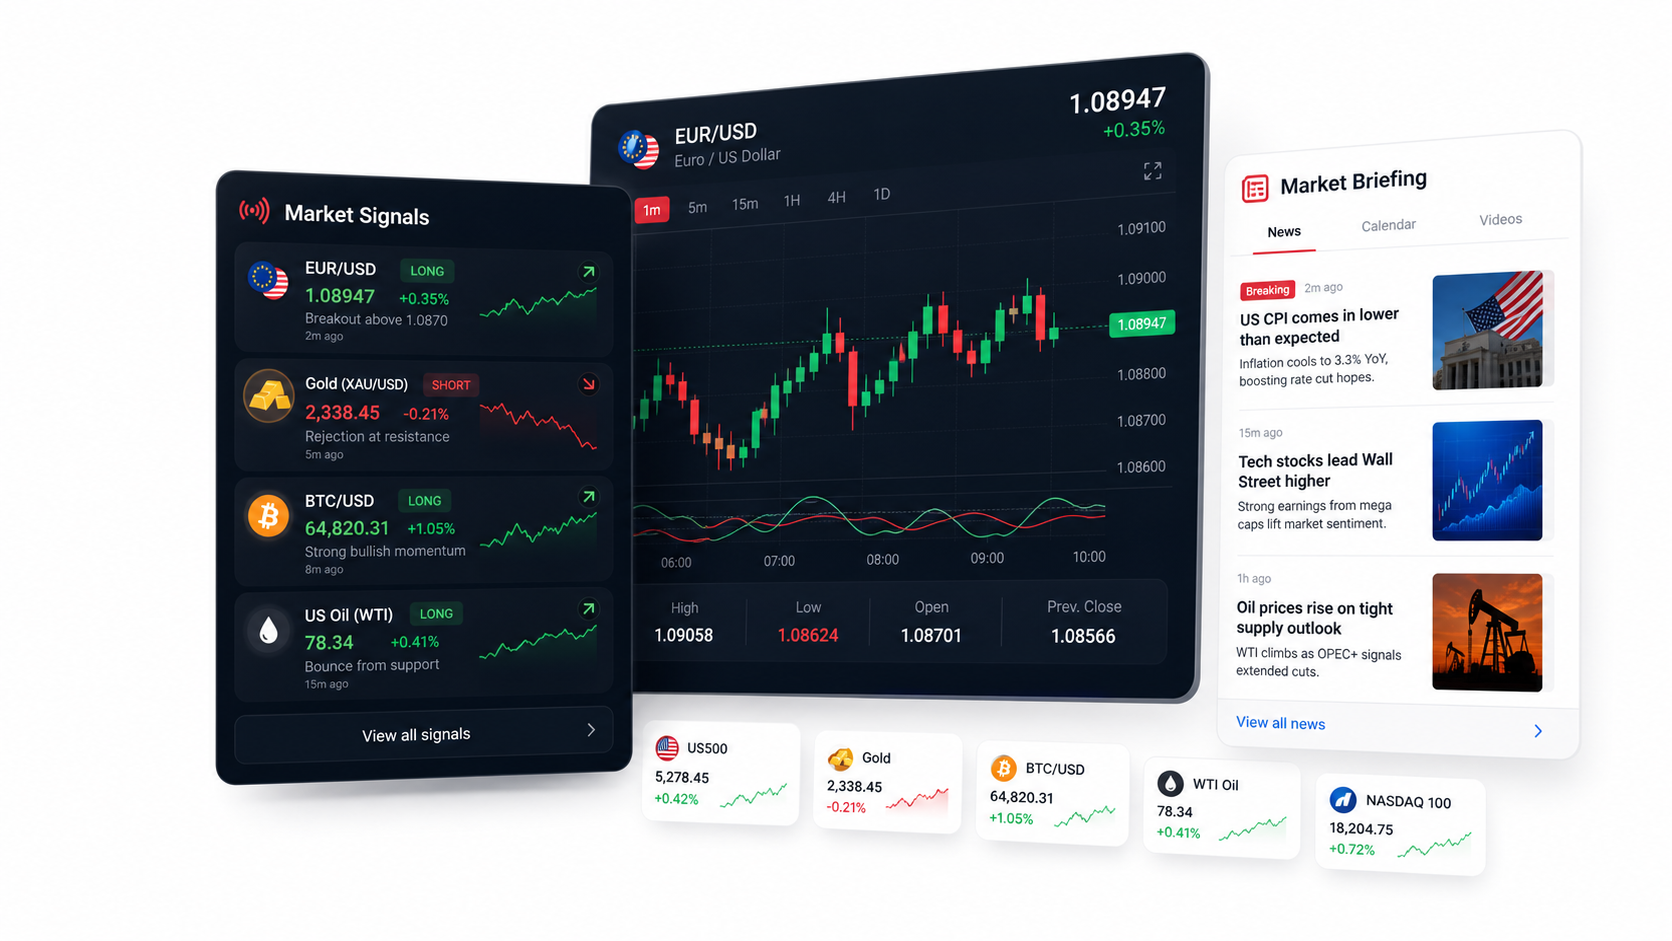
Candlestick charts are the most widely used way to visualize price on a trading platform. At a glance, a single candle tells you where price opened, where it closed, and the highest and lowest points it reached during a chosen period. Learn to read them and you have the foundation for almost every chart-based strategy.
What a single candle shows
Every candlestick summarizes four prices over a fixed time interval — one minute, one hour, one day, and so on. These four values are known as the OHLC: open, high, low and close.
- Open — the price at the start of the period.
- High — the highest price reached during the period.
- Low — the lowest price reached during the period.
- Close — the price at the end of the period.
The body and the wicks
The thick rectangle in the middle of a candle is called the body. It spans the distance between the open and the close. The thin lines extending above and below — the wicks or shadows — mark the high and the low. A long body signals strong directional pressure, while long wicks suggest indecision or rejection of a price level.
Bullish vs. bearish candles
Colour tells you direction at a glance. When price closes higher than it opened, the candle is bullish; when it closes lower, it is bearish. Most platforms colour bullish candles green and bearish candles red, though you can usually customize this.
- Bullish candle: close is above the open — buyers were in control.
- Bearish candle: close is below the open — sellers were in control.
Patterns worth knowing
Individual candles become more powerful when you read them in groups. A handful of classic patterns appear again and again across every market and timeframe.
Single-candle signals
A doji — where the open and close are almost equal — points to indecision. A hammer, with a small body and a long lower wick, can hint at a reversal after a downtrend.
Multi-candle signals
An engulfing pattern, where one candle's body completely covers the previous one, often marks a shift in momentum. As always, patterns are probabilities, not guarantees — confirm them with the wider trend and your own rules.
Key takeaways
- Each candle encodes four prices: open, high, low and close.
- The body shows the open-to-close range; the wicks show the high and low.
- Colour signals direction — bullish (close up) or bearish (close down).
- Patterns are higher-probability clues, not certainties — always manage your risk.
Practice on a demo first
The fastest way to internalize candlestick reading is to watch live charts without risking capital. Open a demo account, choose a single instrument, and study how candles form in real time before you trade with real money.
This article is educational content and does not constitute investment advice. Trading carries risk; never trade with money you cannot afford to lose.